
Climate & Weather Statistics for Beaumont, California (92223)
The best time of year to visit Beaumont
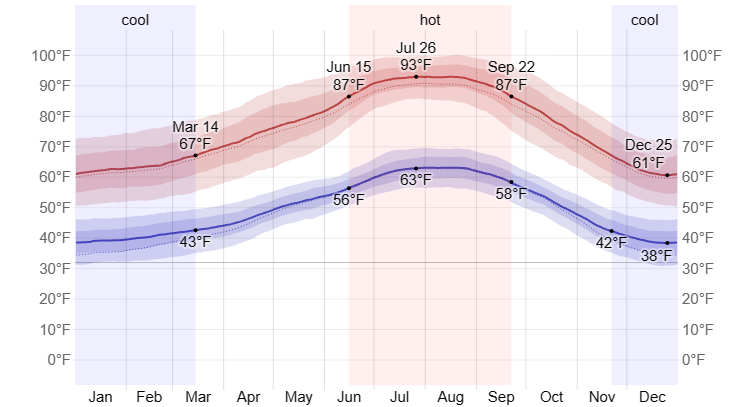
Beaumont reaches an average high of 95 °F (35 °C) during the Summer and an average low of 38 °F (3 °C) during the Winter.
During the months of March, April, May and November you are most likely to experience good weather with pleasant average temperatures that fall between 68° F (20°C) and 79° F (26°C).
Other facts from our historical weather data:
- Does Beaumont have a dry season?
Yes, the months of May, June, July, August, September and October are very dry. - Which is the warmest month in Beaumont?
July has an average maximum temperature of 95°F (35°C) and is the warmest month of the year. - Which is the coldest month in Beaumont?
December is the coldest month is with an average maximum temperature of 60°F (16°C). - Which is the wettest month in Beaumont?
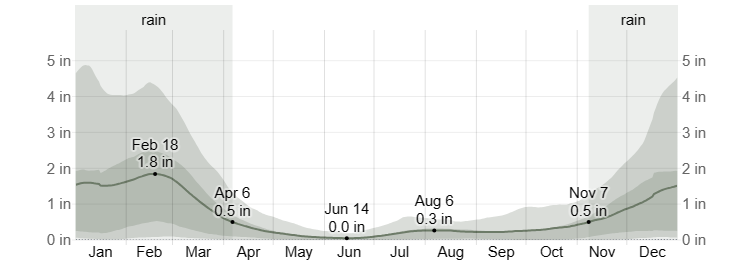
December tops the wettest month list with 87mm (3.4in) of rainfall. - Which is the driest month in Beaumont?
June is the driest month with 1mm (0.0in) of precipitation.
Beaumont, California is located in the foothills of the San Gorgonio Mountains, which are part of the Mojave Desert:
- Location: Beaumont is situated at the peak of the San Gorgonio Pass, which connects the Coachella Valley to the Los Angeles/Riverside/San Bernardino area.
- Elevation: Beaumont is 2,500–3,000 ft (760–910 m) above sea level.
- Climate: Beaumont's elevation provides cooler summers and occasional snow.
- Access: Beaumont is close to deserts, mountains, beaches, and the greater Los Angeles area.
- Transportation: Beaumont is bisected by I-10, a major east-west interstate highway. Beaumont Transit also provides regular service to neighboring cities.
The Mojave Desert includes the High Desert region of California. The High Desert can be defined in different ways, depending on how the boundaries of the Mojave and Colorado Deserts are defined
Average Day and Night Temperature
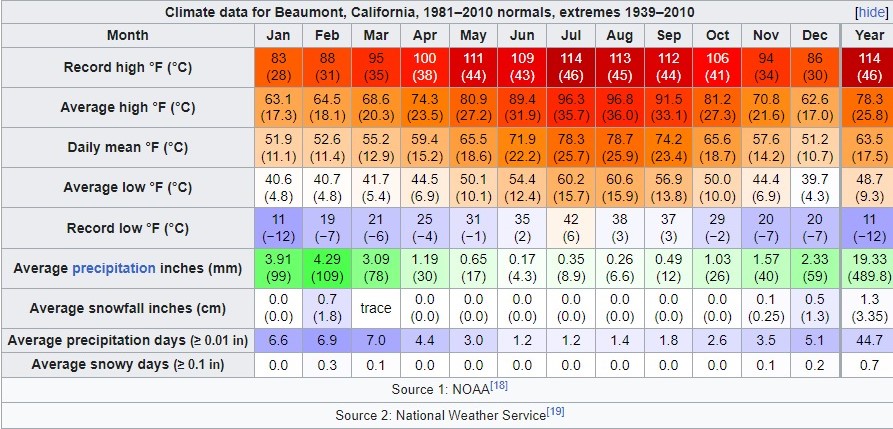
Beaumont, California Climate Summary
Climate in Zip 92223 (Beaumont, CA)
Beaumont, CA, located in the Inland Empire region of California, has a Mediterranean climate characterized by warm summers and mild winters. The average temperature in summer ranges between 75-95°F, while the winter average is between 40-60°F. Beaumont experiences little to no rainfall during the summer months and slightly higher rainfall during the winter months. Snowfall is rare in this area as well.
Beaumont (zip 92223), California gets 23 inches of rain, on average, per year. The US average is 38 inches of rain per year.
Beaumont (zip 92223) averages 1 inches of snow per year. The US average is 28 inches of snow per year.
On average, there are 271 sunny days Beaumont (zip 92223). The US average is 205 sunny days.
Beaumont (zip 92223) gets some kind of precipitation, on average, 40 days per year. Precipitation is rain, snow, sleet, or hail that falls to the ground. In order for precipitation to be counted you have to get at least .01 inches on the ground to measure.
Weather Highlights
Summer High: the July high is around 98 degrees
Winter Low: the January low is 39
Rain: averages 23 inches of rain a year
Snow: averages 1 inches of snow a year
May, October and April are the most pleasant months in the 92223-zip code, while July and August are the least comfortable months.
Climate Averages
| Beaumont, California | United States | |
| Rainfall | 22.6 in. | 38.1 in. |
| Snowfall | 0.7 in. | 27.8 in. |
| Precipitation | 39.7 days | 106.2 days |
| Sunny | 271 days | 205 days |
| Avg. July High | 97.7° | 85.8° |
| Avg. Jan. Low | 39.4° | 21.7° |
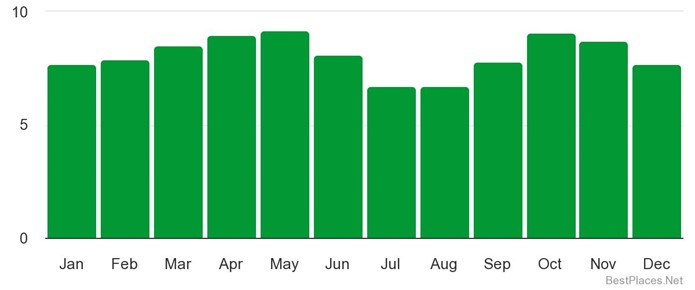
| Comfort Index (higher=better) | 8.1 | 7 |
| UV Index | 5.7 | 4.3 |
| Elevation | 2703 ft. | 2443 ft. |
Average Monthly Rainfall in Beaumont, CA
(California Rainy Season Runs from October 16 - April 15)
California Winds


")